
On the Interconnectedness of External Representations
We often think of external representations as separate islands. We have charts over here, diagrams over there, maps over there, and so on. I don’t really view it that way. I enjoy finding bridges between these different islands. In fact I think there is tons of exciting work to be done by looking for these bridges, and I wish that the visualization research community would invest more in studying this broader class of artifact.
Some examples of these connections
Vega Label: Cartography -> Vis
Vega’s label transform is partially derived from a labeling strategy created for cartography. (See the Vega label paper, which cites “Positioning names on maps”.)
If we look more closely at this paper, we can see that it separates labels into three types: position (point), linear (line), and areal/surface (area). These are very similar to the three kinds of marks defined in Bertin’s Semiology of Graphics (he was a cartographer after all), and that have ended up as a part of GoFish’s internal representation of shapes. There are many other cartography papers on label layout for all three kinds of labels that could probably be transported into vis for better automatic label layout.
Benthic: Vis <-> Screen Readers
When we built Benthic, a structure for screen reader navigation, we were connecting ideas about the structure of graphics and with the structure of screen reader representations. By doing so, we could make screen reader structures that aligned with the structures researchers hypothesize sighted people use to navigate a diagram. In the process though, we started to understand the importance of attention. What information in the graphic can a user perceive at any given time? This problem has been studied a bit (eg Boger & Franconeri), but remains very understudied.
GoFish: Diagrams -> Charts
We spent a long time coming up with a nice structure of diagrams in the Bluefish project. At first it wasn’t totally clear whether all the relational stuff would be relevant except at the “margins” for things like labeling. But actually there are many common charts (like mosaic, waffle, and ribbon charts) that have similar structure to diagrams! (In fact you can turn the Bluefish planets example into a bar chart without changing its spatial structure very much at all!)
Bluefish: UIs -> Diagrams
It took us a long time to figure out how to do diagram layout well. Common wisdom is to use global constraint solvers. But it turns out that UI frameworks have tackled very similar layout issues, and we can transport these into diagramming. (And then eventually into visualization via GoFish.)
In Bluefish, we also drew inspiration from Gestalt principles. Even though they are often mentioned in visualization classes, they are typically more relevant in graphic and UI design, where there is a lot more hierarchical structure. Nevertheless they are present in visualization as well. And of course it’s interesting to think about what kind of grouping structures exist tactile and auditory mediums.
Pretty Printing
This one is a bit less explored, but I’ve always been interested in how code formatters work. They’re really interesting algorithms. In fact they are actually layout algorithms! And they are very similar to the paragraph layout techniques found in LaTeX and Typst, too!
One interesting idea in this algorithms is the use of a “choice” operator that basically gives you a superposition of multiple possible layouts. After you’ve constructed a set of alternatives, you then extract an “optimal” alternative from the set. These layout strategies have techniques for making this process efficient using dynamic programming and pruning.
Here’s a pretty printing paper I really like. I especially love these diagrams of how the algorithm represents pieces of text. I think it’s really cool how there are no characters of text inside the blocks!

In visualization we have papers that look at automatically choosing a visualization given the available display space. Eg this constraint-based breakpoints paper from the most recent VIS. This strikes me as being a very similar problem, and I imagine there might be some bridges here.
Inspiration for this post
I was inspired to write this post by watching Timothy Gowers’s lecture on “The Importance of Mathematics”.
He gave some images for people’s perceptions of mathematics and the reality.
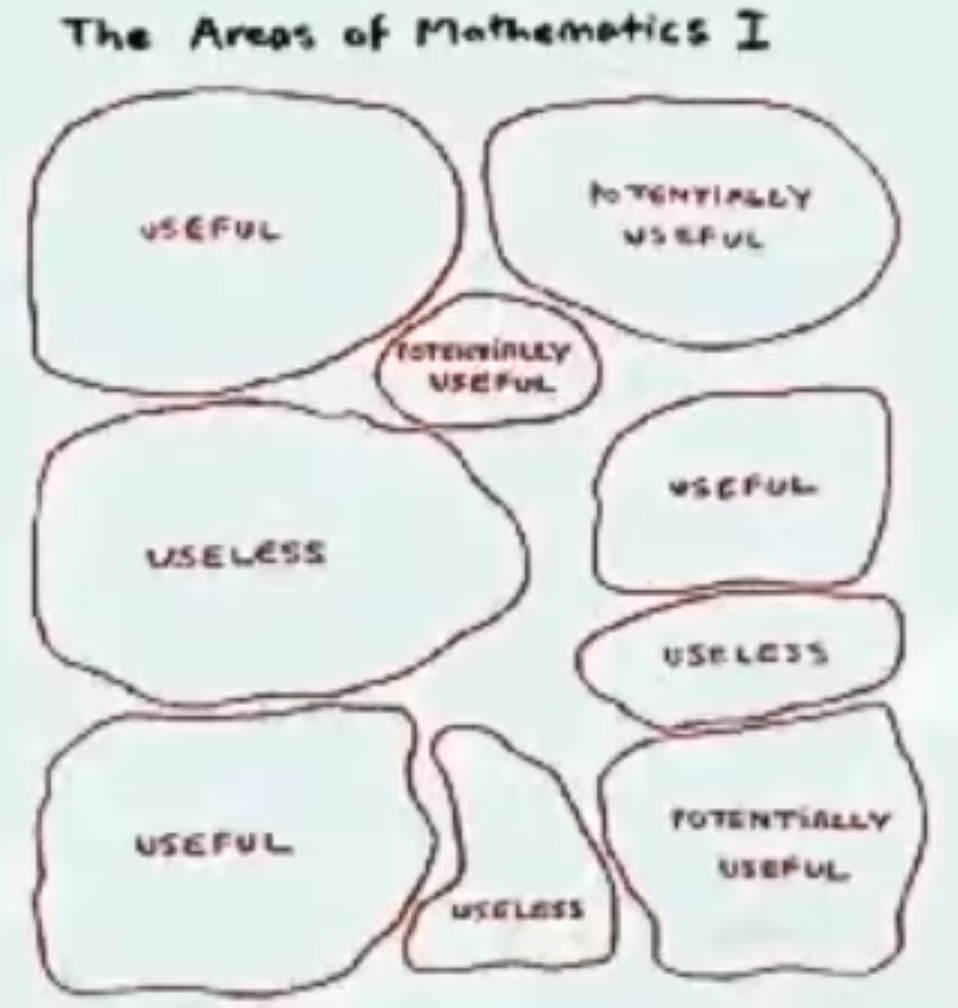
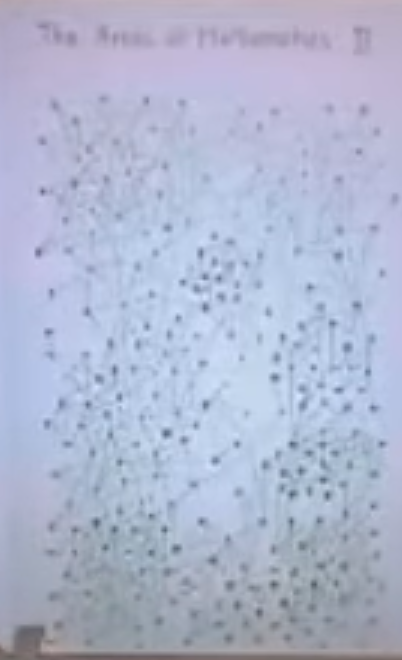
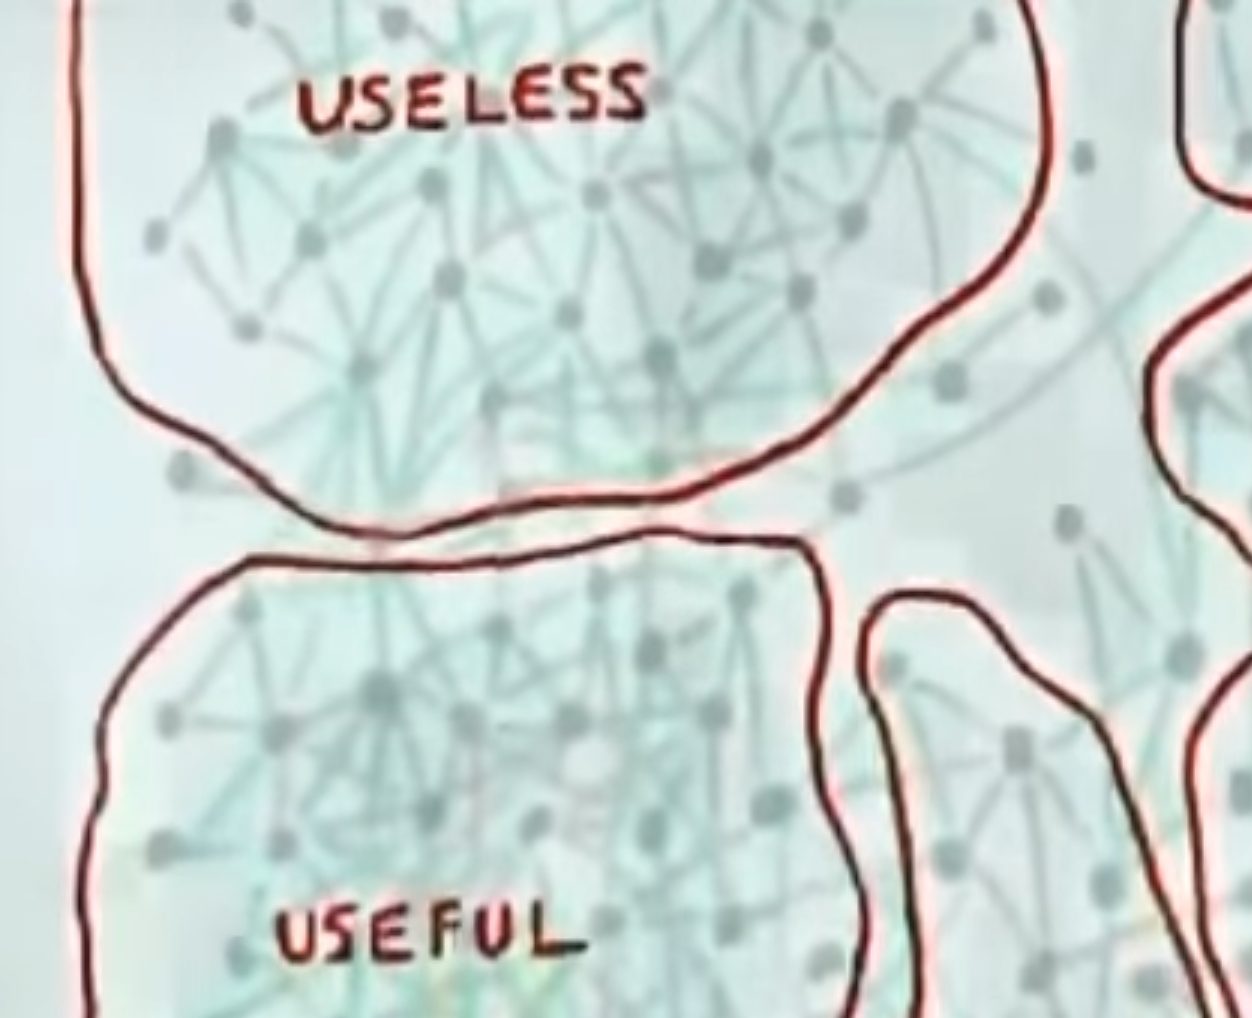
I have a very similar image of my head of how external representations are connected. It’s also why I strongly believe that we should study all kinds of representations regardless of how widely used they are. Over and over again I’ve seen all kinds of connections between representations. And different kinds of representations seem to emphasize different parts of some more global picture of how external representations are structured and how they communicate.